 |
Stock Charting:
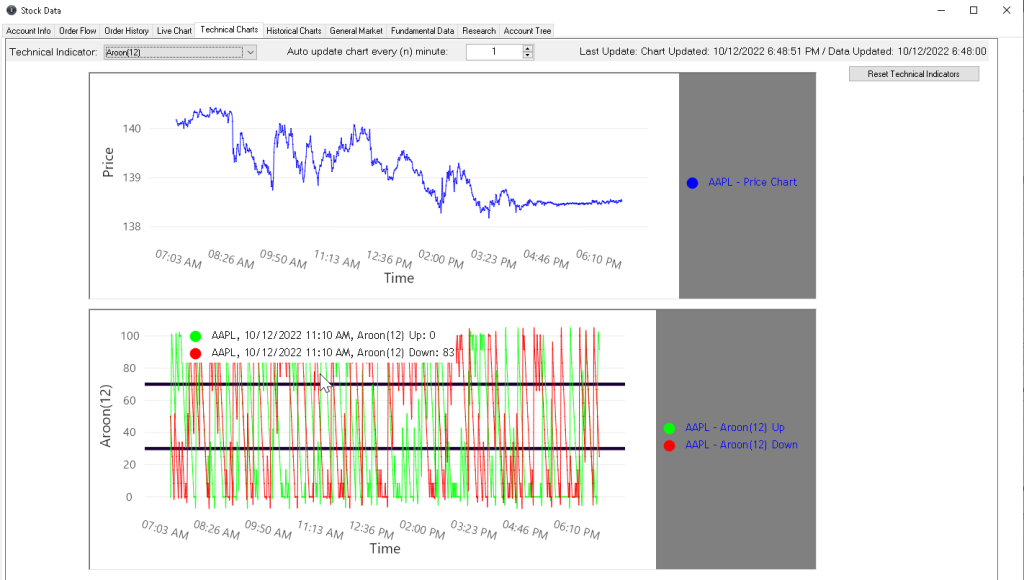
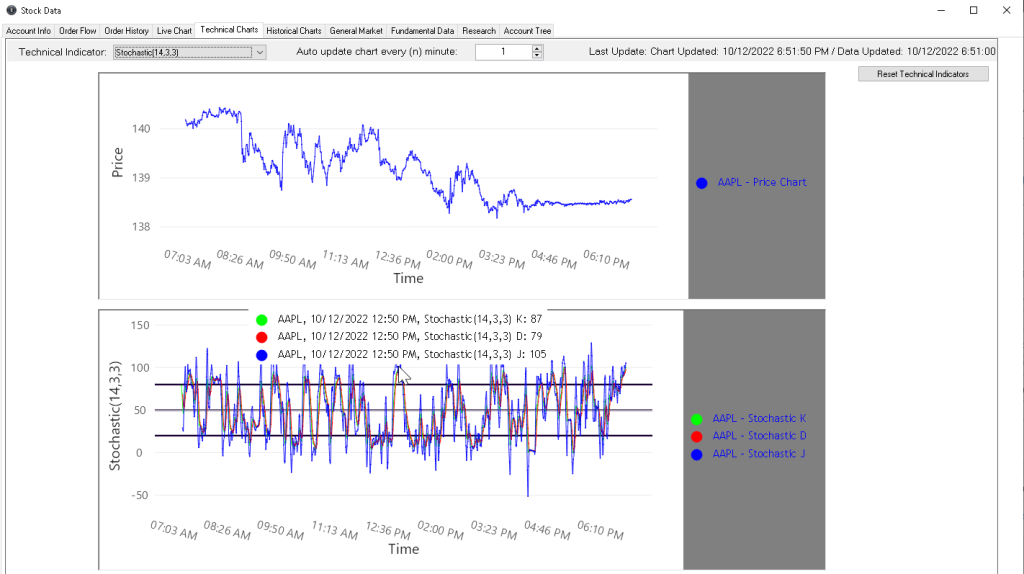
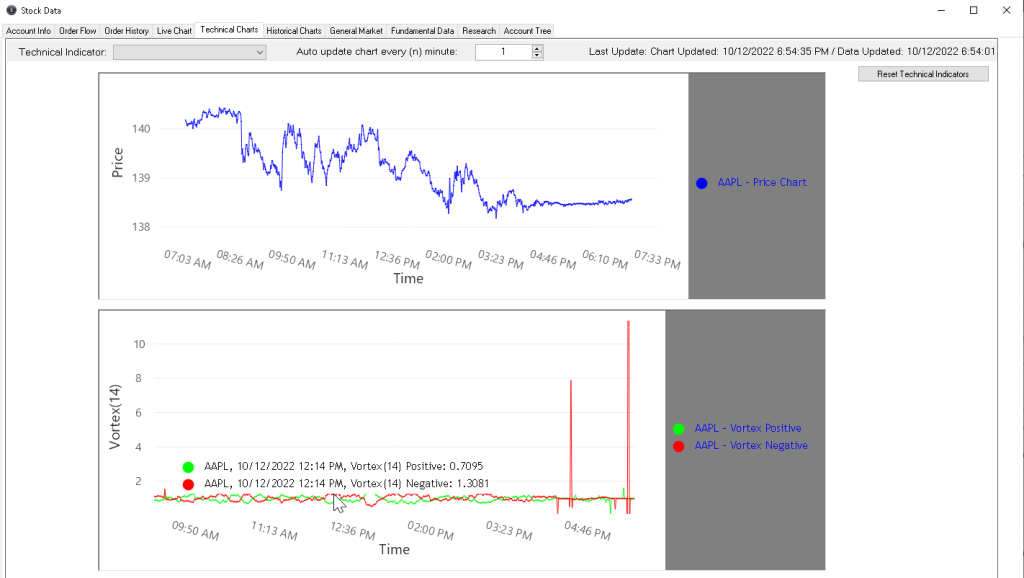
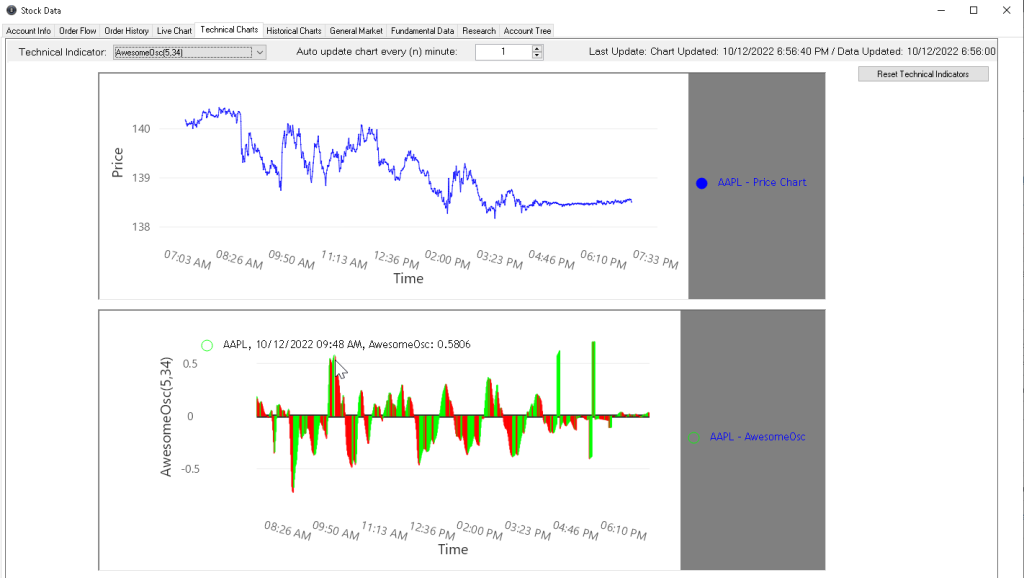
Live updated price and volume charts are available for the stock being traded. Technical charting of the stock are available including SMA, MACD, EMA, Aroon, Bollinger, VWAP, Vortex, Stochastic and more! Historical charts (minute, day, month, year) of stocks available with inlaid technical indicator all inside the bot program. |
Live Charts & Technical Indicators:
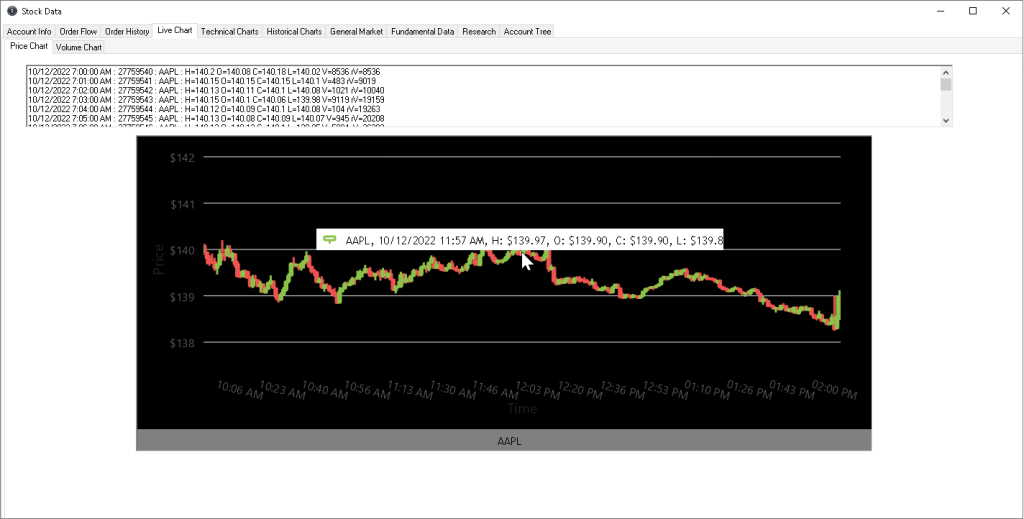
Auto updating charting with full candle sticks including zooming ability. Captions with price/technical indicator points by hovering over a select candle while bot is running.
- To access Live Chart: on the top menu of the main window of the bot select Stocks -> View Stock/Option Data and a Stock Data window will appear. Click on the Live Chart tab.
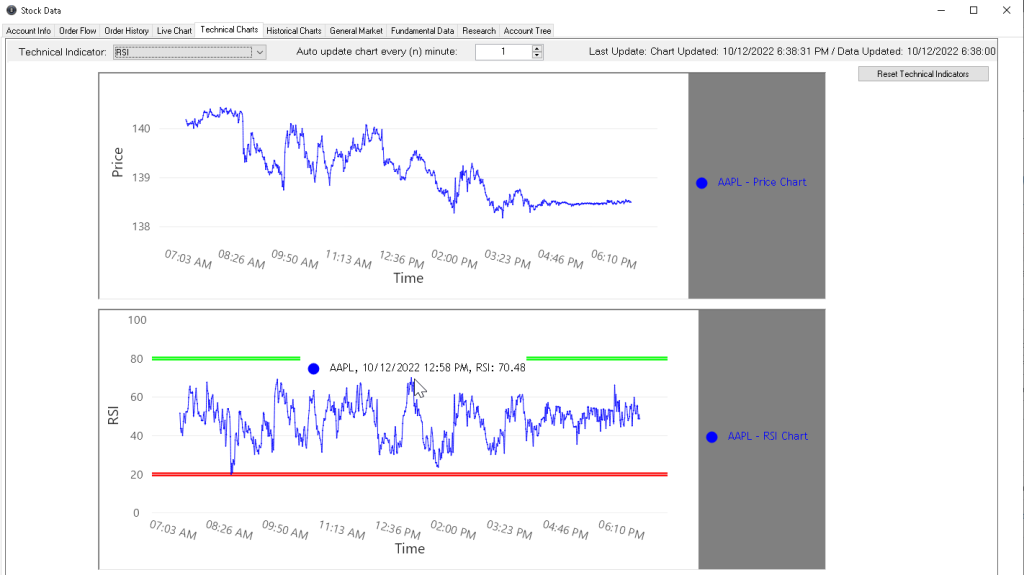
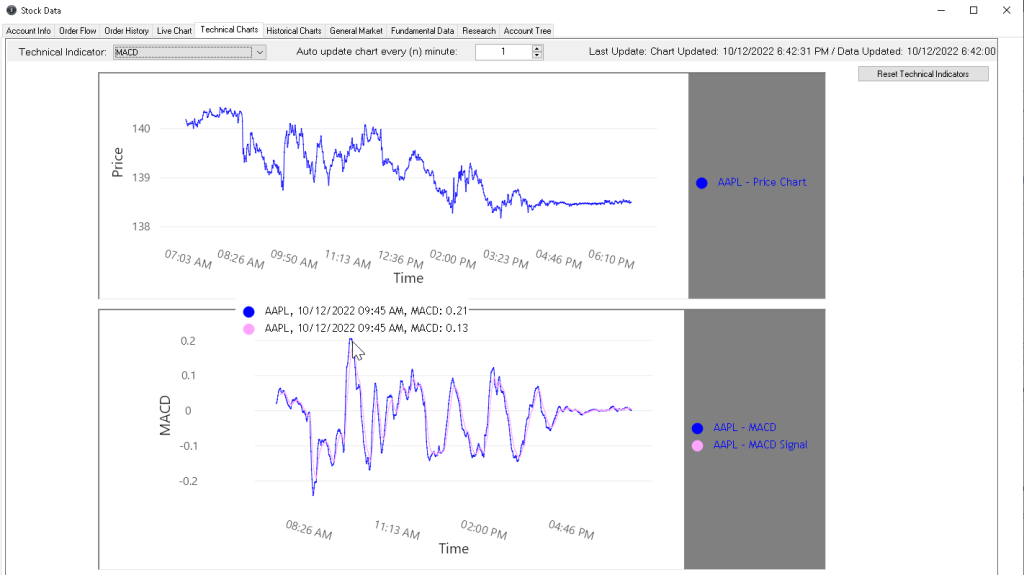
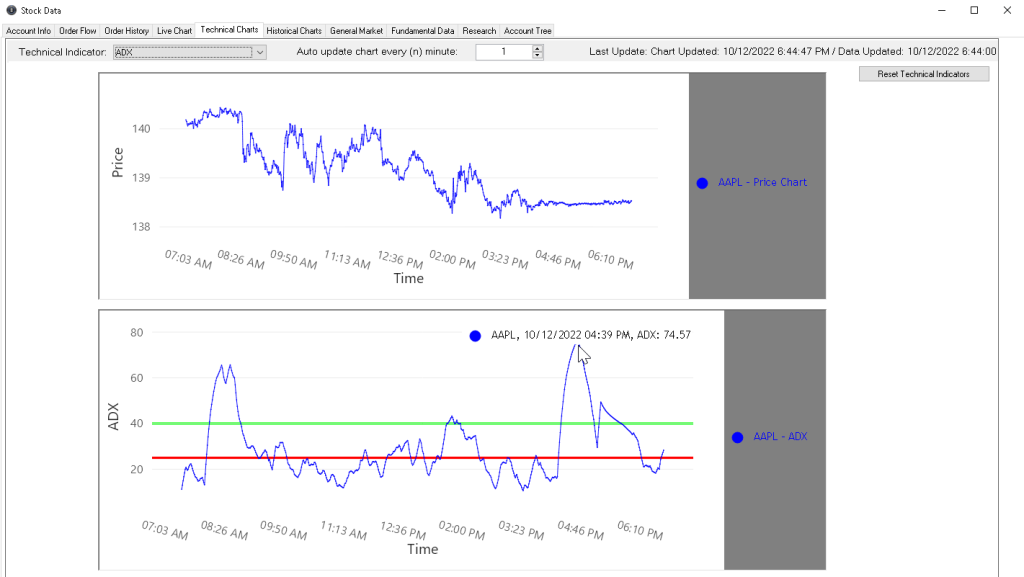
- To access Technical Charts: on the top menu of the main window of the bot select Stocks -> View Stock/Option Data and a Stock Data window will appear. Click on the Technical Charts tab.
Technical indicators are available including all of the following available indicators with some examples below:
SMA, SMA(Period), RSI, RSI(Period), Bollinger, MACD, ADX, VWAP, Aroon(Period), EMA(Period), Stochastic(Period,Signal,Smoothing), Vortex(Period), AwesomeOsc(Period,Period2).


Show More Live Technical Charts


Show Less Live Technical Charts
Historical Charts & Indicators:
Historical charts are available in the bot and allow users to check previous charts on stocks.
Options include selecting a stock ticker, selecting a date model (day, month, year) and viewing the prior chart.
